Learn how to use diagram templates in diagrams.net

    use cases   templates   shape libraries

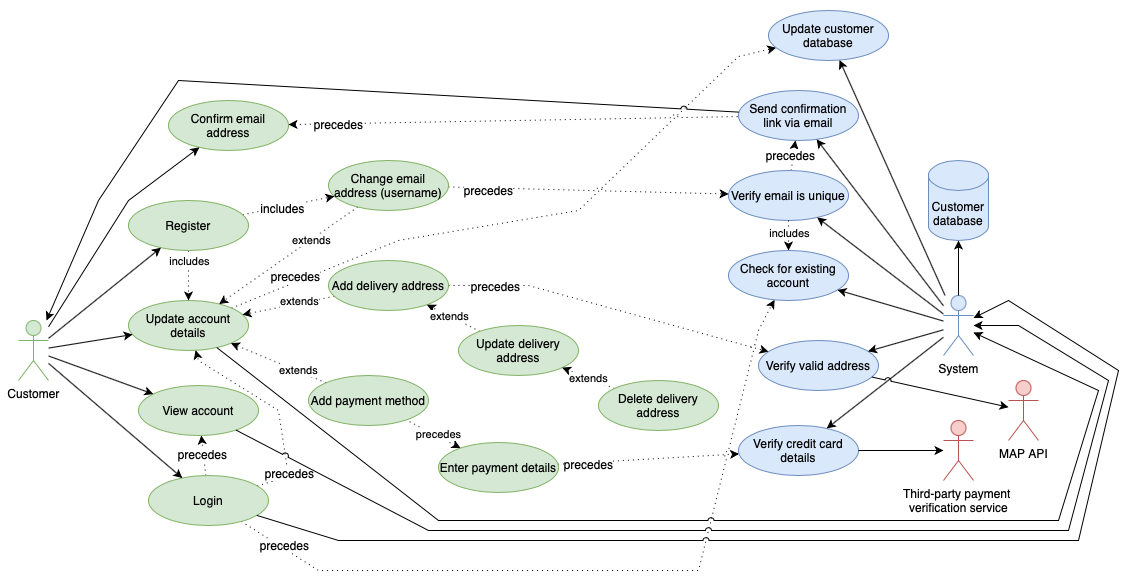
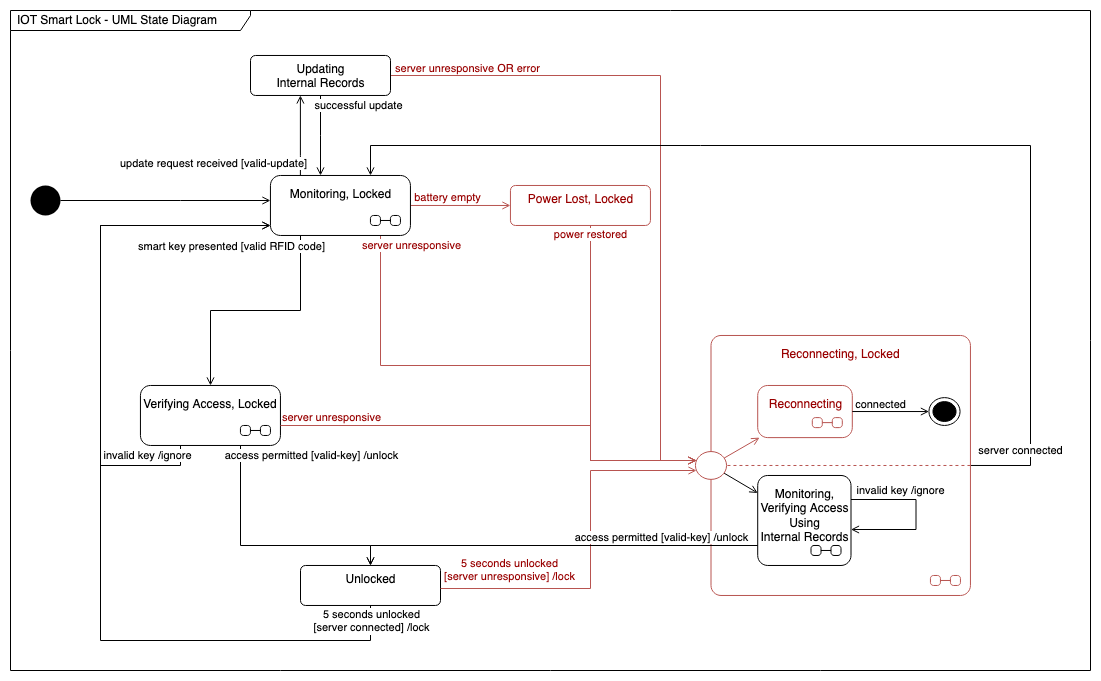
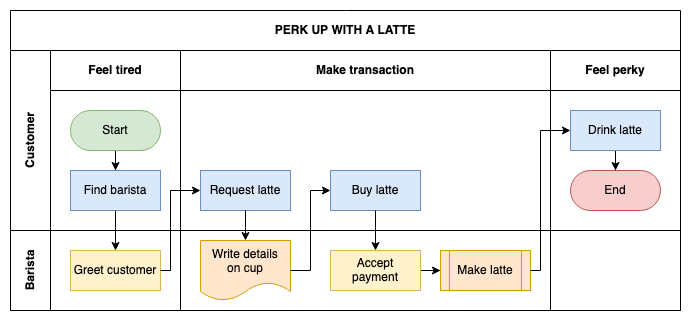
    Draw UML activity diagrams

    UML activity diagrams show the sequence of actions and the flow of control in a system or a process. You can model the behaviour of physical and digital systems, as well as business process flows with activity diagrams.
    UML activity diagrams are used to model the flow of control and sequence of actions in a process or system
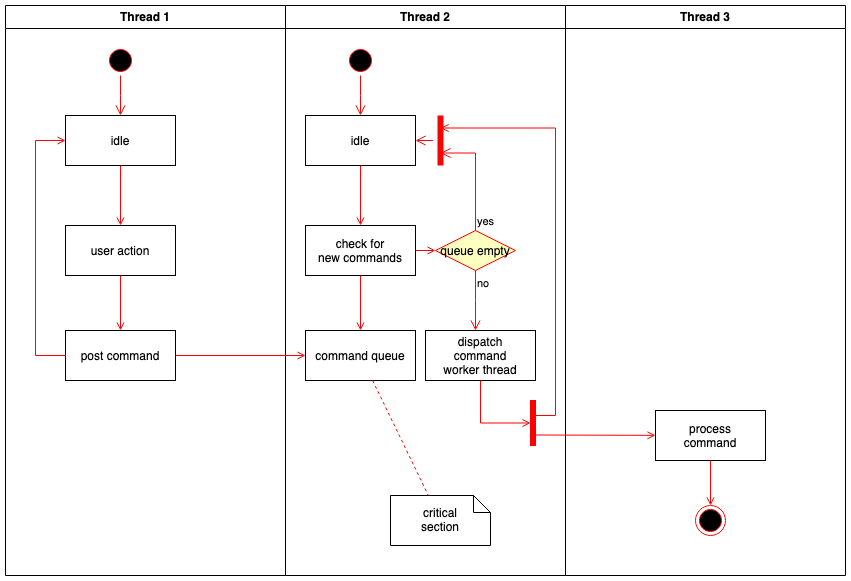
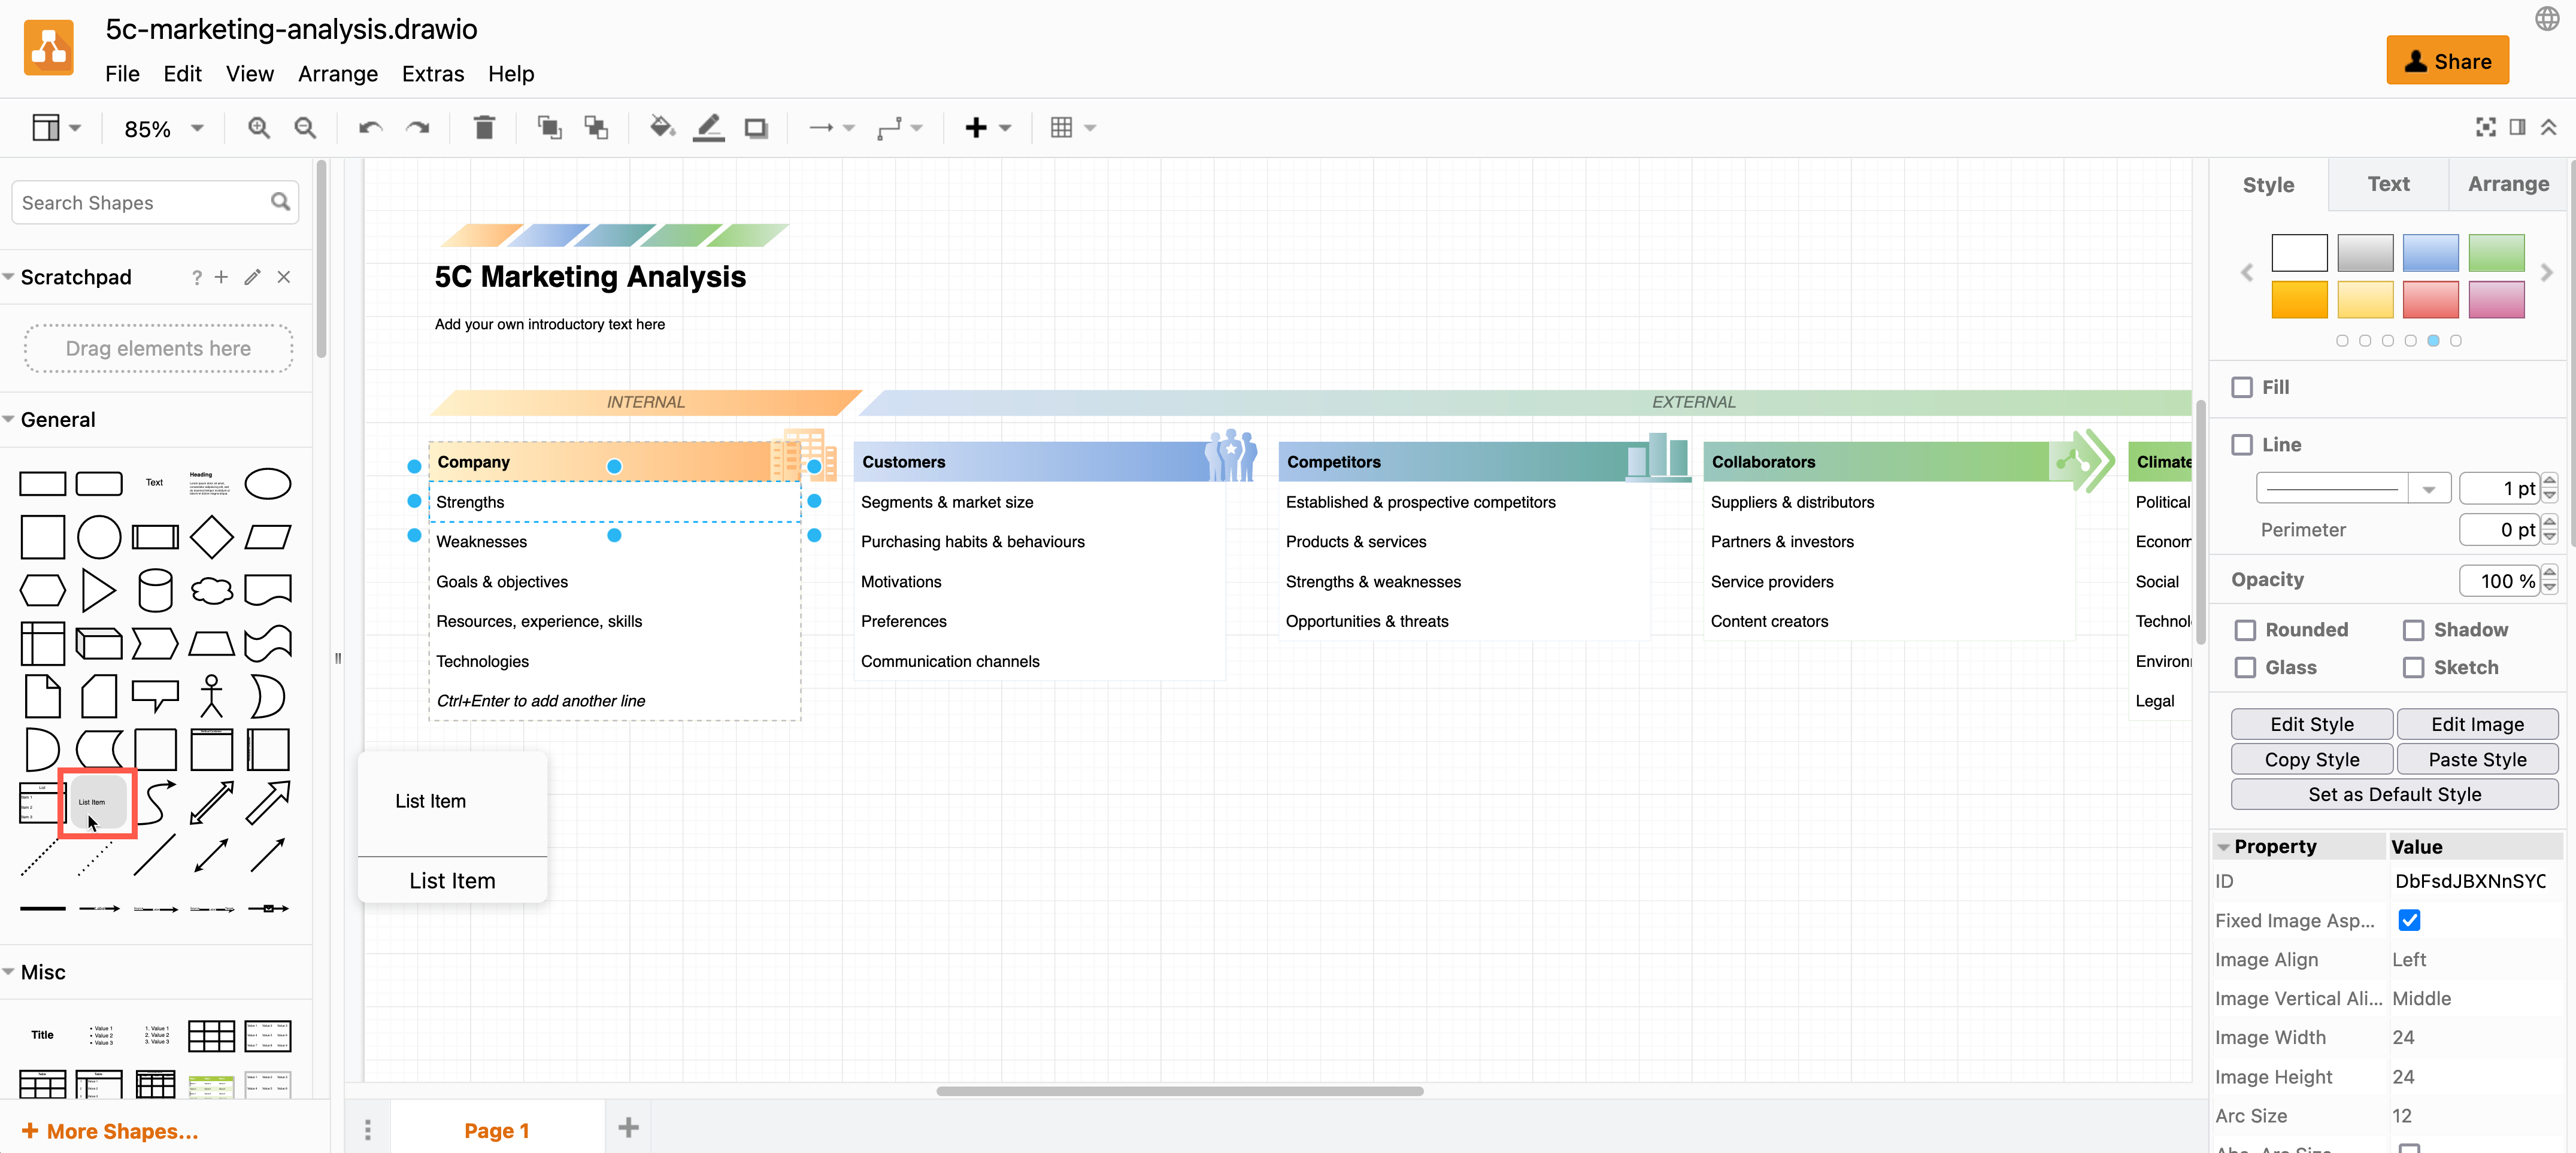
    UML activity diagram template in diagrams.net and draw.io

    23 Nov 2022
    use cases   templates   shape libraries

    Draw a UML use case diagram

    UML use case diagrams show all of the ways an end-user interacts with your systems, with all of its pre- and post-conditions, exceptions and alternate paths. These diagrams are used to establish your system requirements, whether that be a software system or an interaction with another person or team.
    An example of a use case diagram

    26 Sep 2022
    use cases   templates   shape libraries

    Create a sequence diagram

    Sequence diagrams show the order of messages that are passed between elements of a system to complete a particular task or use case. The events that cross system boundaries are used by objects and people (actors) to complete their processes.
    diagrams.net contains several examples of UML sequence diagrams in its template library

    16 May 2022
    use cases   templates   shape libraries

    Create UML class diagrams

    UML class diagrams are used to illustrate the structure of a computer program. They detail the types of data or attributes stored within each ‘class’, the methods (operations or functions) that each class provides, and the relationships between the classes.
    A class diagram based on the basic class diagram template in diagrams.net

    22 Mar 2022
    use cases   shapes   templates

    Draw timelines and roadmaps in diagrams.net

    Timelines, roadmap and milestone diagrams feature in a range of documentation - project development documents, infographics and presentations being some of the most common. There are many shapes and templates in diagrams.net and our draw.io branded apps that you can use to quickly draw an attractive diagram that you can embed in your presentation or documentation.
    Draw timelines, roadmaps and milestone diagrams easily with diagrams.net

    14 Feb 2022
    templates   use cases   shapes

    Draw circular flowcharts

    Flowcharts are one of the most used types of diagrams in all teams. But some process flows are circular or cyclical rather than a series of steps with a start and end. You can create circular flowcharts in diagrams.net and our draw.io branded apps in a number of ways.
    Create a circular flowchart using basic shapes in diagrams.net

    31 Jan 2022
    use cases   templates

    Ishikawa diagrams for root cause analyses

    Ishikawa diagrams, also called fishbone, herringbone or cause and effect diagrams, are used to analyse and identify the root causes of defects or negative events. As most problems have multiple causes, Ishikawa diagrams are a useful prompt to look at the many different contributing factors.
    An example of an manufacturing Ishikawa diagram for a defective part

    01 Dec 2021
    use cases   templates

    Draw dependency graphs in diagrams.net

    As a type of directed graph, dependency graphs visualise processes or situations where there are dependent components such as in decision making, scheduling, product development, IT or telecommunications infrastructure, supply and manufacturing chains, and more. They help you find the optimal order and identify critical paths or weak links that would constain your application, infrastructure or process.
    A PERT diagram template that is available in diagrams.net

    09 Jul 2021
    use cases   templates

    Create a remote kanban board with diagrams.net

    Kanban boards show the breakdown of large projects into smaller tasks that you prioritise and track as they are completed. Collaborative projects benefit from a kanban board as it helps everyone visualise workflows, the state of the project, and the current workload.
    The kanban template in diagrams.net automatically updates colours and labels when you move tasks to another column

    21 May 2021
    features   use cases   templates

    Use swimlanes with flowcharts to show who does each step

    Flowcharts are one of the most common diagram types, showing all of the steps that must be followed to complete a process. Not many processes are limited to just one person or one team, which is why swimlane diagrams and cross-functional flowcharts are used - these show the flow of data or control across different groups.
    The basic cross-functional flowchart template after being styled, as provided in the diagrams.net template manager

    09 Mar 2021
    use cases   templates

    Create a rack diagram in diagrams.net

    diagrams.net has a number of shape libraries and templates for creating rack diagrams. Both electronics cabinets can be visualised, as well as IT racks with servers and networking hardware, including those provided by specific vendors like APC, Cisco, Dell, F5, HP, IBM and Oracle.
    An electronics cabinet diagram, created at diagrams.net A simple rack diagram, created with diagrams.net An Arista rack diagram layout, created with diagrams.net

    27 May 2020
    use cases   templates

    Create floorplans and layouts

    Floorplans aren’t only useful for real-estate agents and people who are moving to a new apartment. You can also plan new office spaces, show emergency routes, create a seating chart, plan a conference or trade show layout - anything where you need to arrange people and furniture in a space.
    A ground floor apartment floorplan created in diagrams.net The second floor of an apartment floorplan created in diagrams.net

    02 Mar 2020
    use cases   templates

    How to create a gitflow diagram

    It’s easier to show new development team members your project’s branch structure in your Git repository visually than to describe it in words. Some platforms may illustrate this using built-in tools. If you are using a platform without a convenient visual representation, it’s easy to create your own gitflow diagram.
    An example gitflow diagram

    07 Feb 2020