Edit colours in embedded SVG images
To be able to set the fill and stroke (line) colours of an embedded SVG via a CSS selector, add the editableCssRules key along with a regular expression without flags in the shape style.

Note: This only works for embedded SVG images, not for those that are included via a link. Insert an SVG image into your diagram via File > Import or by dragging the SVG file onto the drawing canvas.
Set the fill and line colours of an SVG to be editable
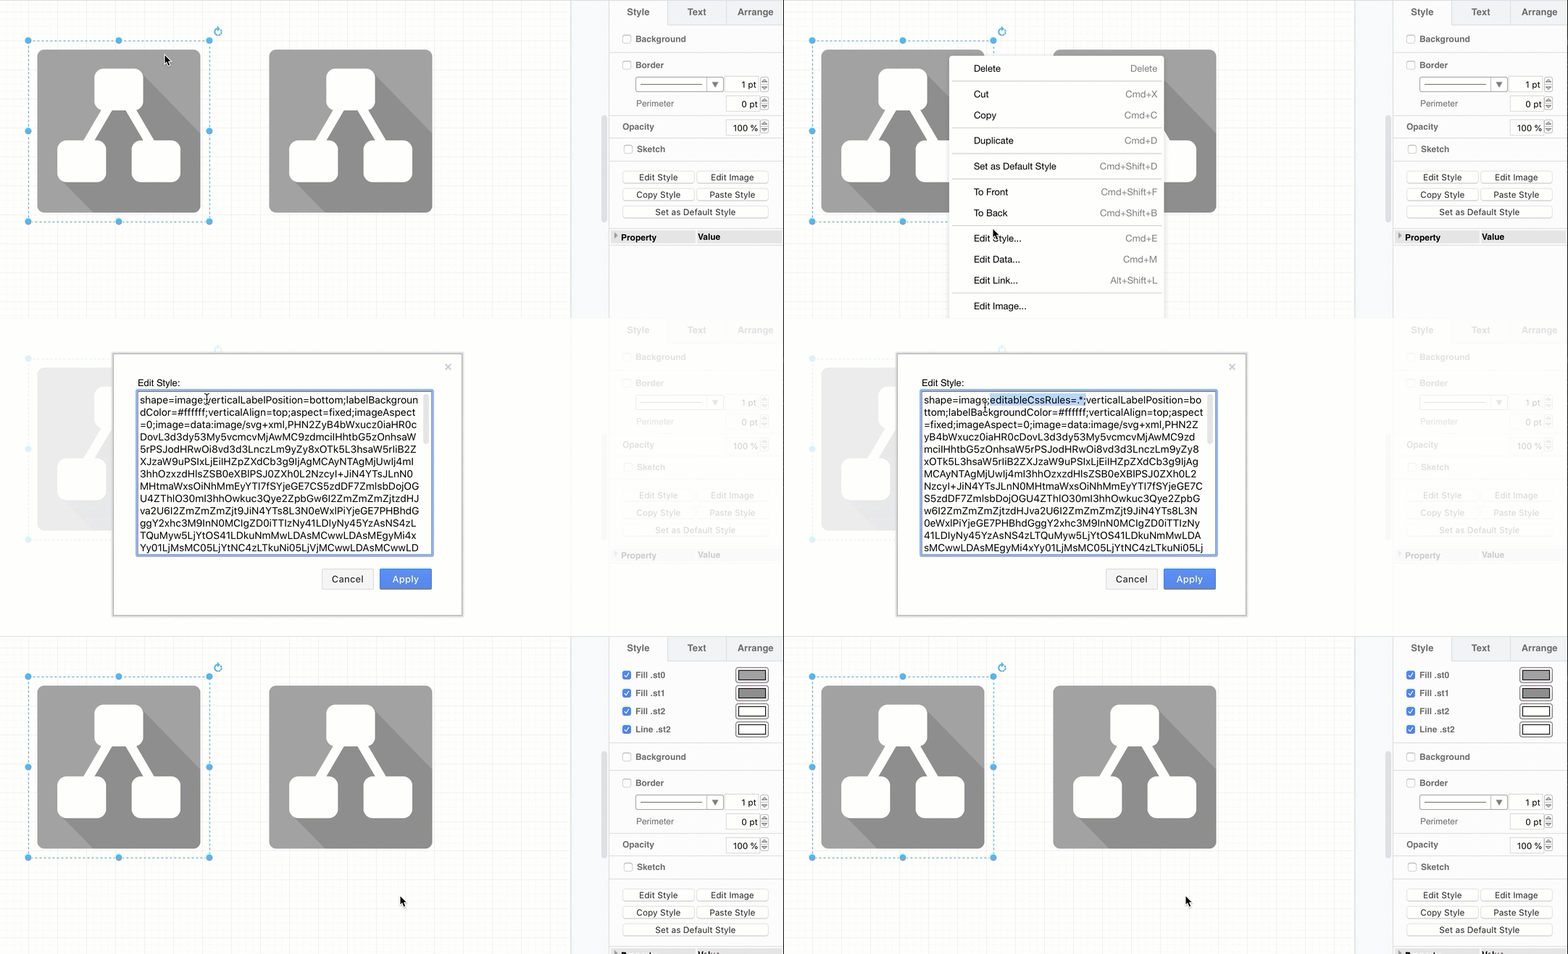
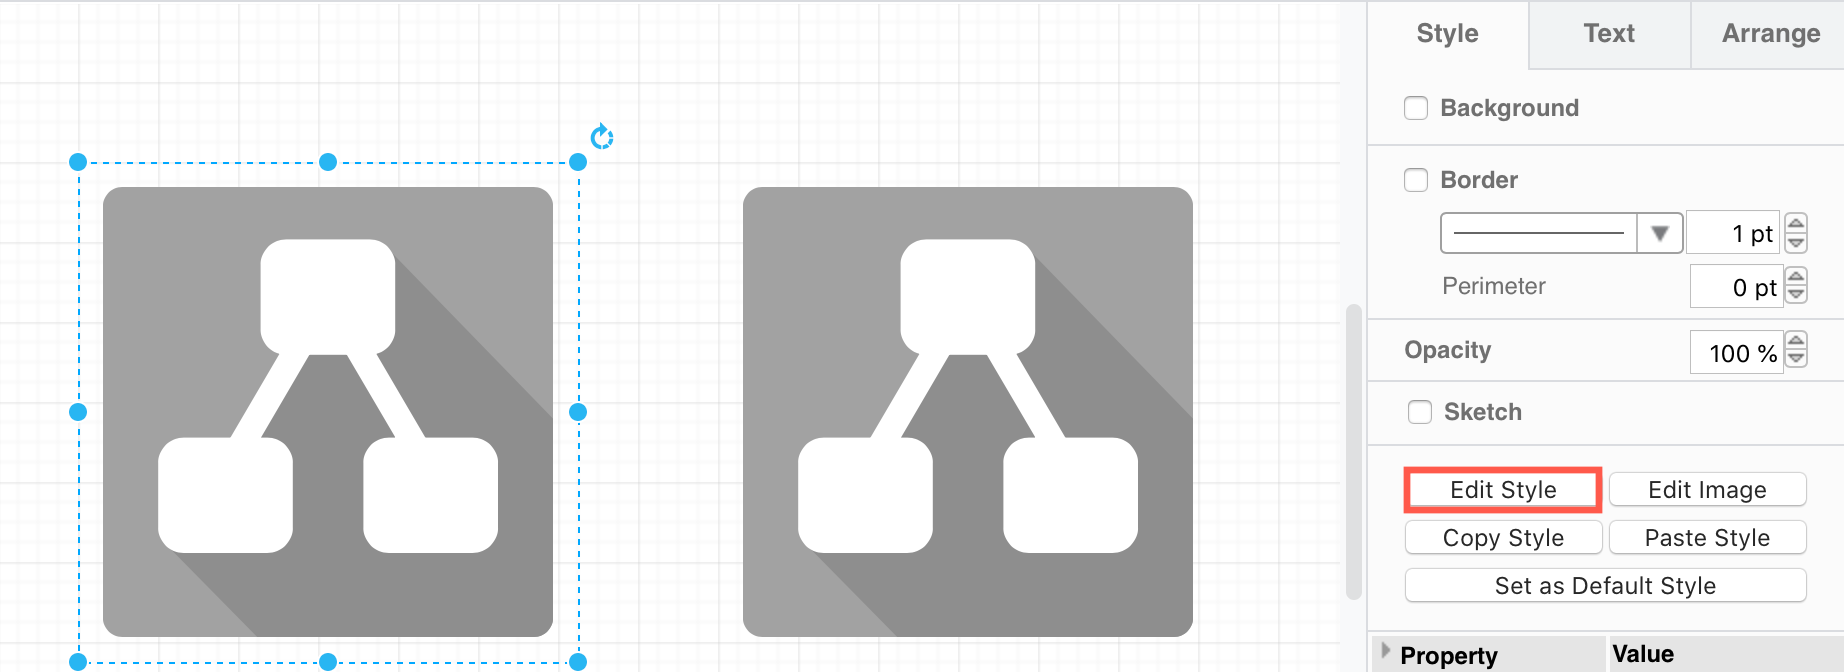
- Select the SVG in your diagram, then click Edit Style in the format panel (press
Ctrl+Eon Windows orCmd+Eon macOS, or select it from the right-click context menu).
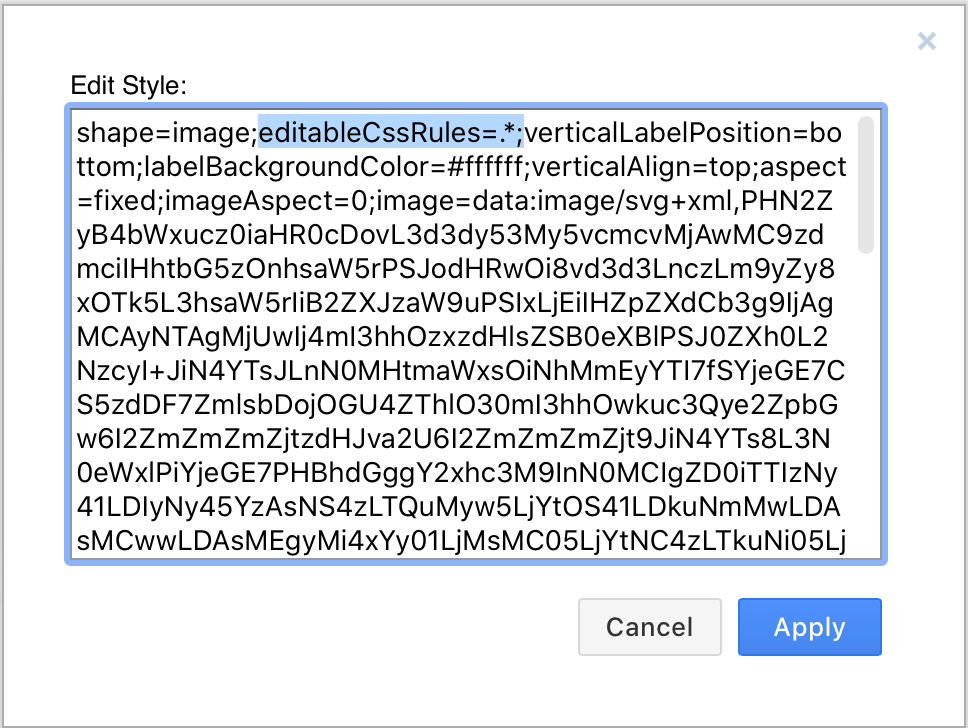
- Add the
editableCssRulesand the regular expression that selects which elements you want to be able to style as akey=valuepair in the style description. For example:- To allow all styles to be edited,
editableCssRules=.*;.
- To limit this in the example below to just
st1andst2, entereditableCssRules=\.st[02];.
- To allow all styles to be edited,
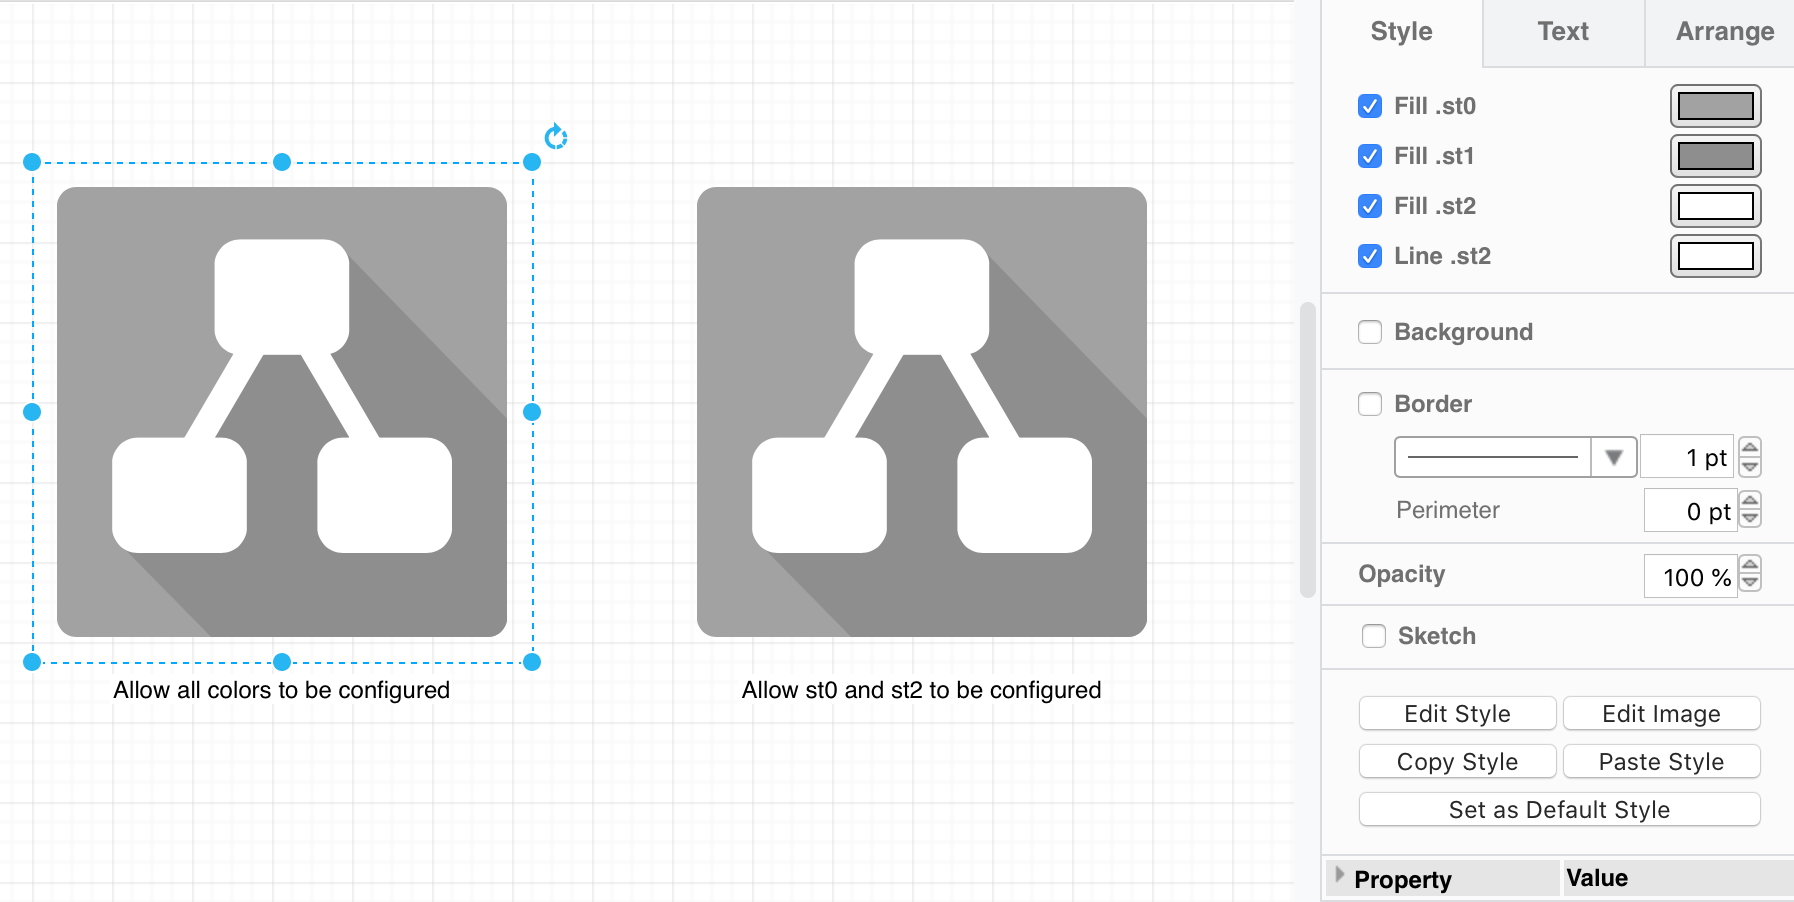
Now, you can style the fill and line colours in the format panel.

For example, in the following SVG, the CSS rules in the <style> section define three CSS classes which are used to style the paths in the SVG.
<svg version="1.1" xmlns="http://www.w3.org/2000/svg" xmlns:xlink="http://www.w3.org/1999/xlink" viewBox="0 0 250 250">
<style type="text/css">
.st0{fill:#a2a2a2;}
.st1{fill:#8e8e8e;}
.st2{fill:#ffffff;stroke:#ffffff;}
</style>
<path class="st0" d="M237.5,227.9c0,5.3-4.3,9.6-9.5,9.6c0,0,0,0,0,0H22.1c-5.3,0-9.6-4.3-9.6-9.5c0,0,0,0,0,0V22.1
c0-5.3,4.3-9.6,9.5-9.6c0,0,0,0,0,0h205.9c5.3,0,9.6,4.3,9.6,9.5c0,0,0,0,0,0V227.9z"/>
<path class="st1" d="M237.5,227.9c0,5.3-4.3,9.6-9.5,9.6c0,0,0,0,0,0H89.6L44.8,192l27.9-45.5l82.7-102.7l82.1,84.5V227.9z"/>
<path class="st2" d="M197.1,138.3h-23.7l-25-42.7c5.7-1.2,9.8-6.2,9.7-12V51.5c0-6.8-5.4-12.3-12.2-12.3c0,0-0.1,0-0.1,0h-41.7
c-6.8,0-12.3,5.4-12.3,12.2c0,0,0,0.1,0,0.1v32.1c0,5.8,4,10.8,9.7,12l-25,42.7H52.9c-6.8,0-12.3,5.4-12.3,12.2c0,0,0,0.1,0,0.1
v32.1c0,6.8,5.4,12.3,12.2,12.3c0,0,0.1,0,0.1,0h41.7c6.8,0,12.3-5.4,12.3-12.2c0,0,0-0.1,0-0.1v-32.1c0-6.8-5.4-12.3-12.2-12.3
c0,0-0.1,0-0.1,0h-4l24.8-42.4h19.3l24.9,42.4h-4.1c-6.8,0-12.3,5.4-12.3,12.2c0,0,0,0.1,0,0.1v32.1c0,6.8,5.4,12.3,12.2,12.3
c0,0,0.1,0,0.1,0h41.7c6.8,0,12.3-5.4,12.3-12.2c0,0,0-0.1,0-0.1v-32.1c0-6.8-5.4-12.3-12.2-12.3
C197.2,138.3,197.2,138.3,197.1,138.3z"/>
</svg>
See this as an example in diagrams.net
Note: Semicolons are not allowed in the style calues, as a semicolon is used to separate the key=value pairs in the shape style.
This feature is available in draw.io 8.7.0 and later.