Draw dependency graphs in diagrams.net
As a type of directed graph, dependency graphs visualise processes or situations where there are dependent components such as in decision making, scheduling, product development, IT or telecommunications infrastructure, supply and manufacturing chains, and more. They help you find the optimal order and identify critical paths or weak links that would constain your application, infrastructure or process.
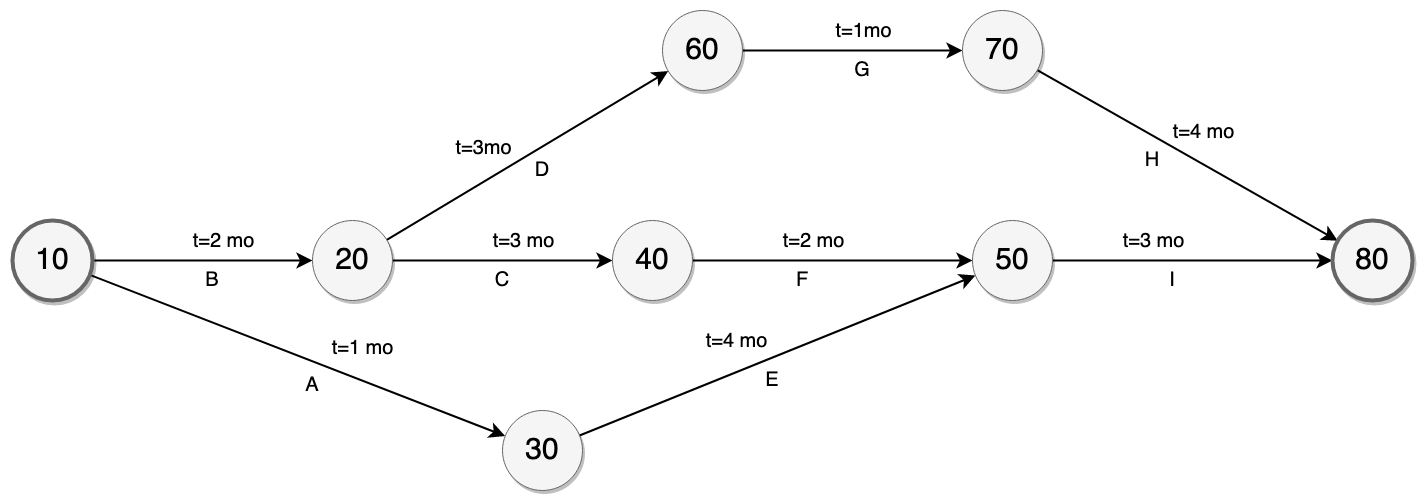
The shapes and connectors used in dependency graphs are simple - one shape indicates nodes (usually circles or ellipses), and connectors with one or two arrow heads to indicate the direction of the dependencies. Connectors may or may not have labels.
Specialised dependency graphs
A PERT diagram (program evaluation and review technique) is a type of dependency graph for task-based projects that includes time estimates for each activity, usually on each node. Used with the critical path method, this identifies the longest path of dependencies and indicates the time needed to complete them. The following diagrams.net template is in the Business category.
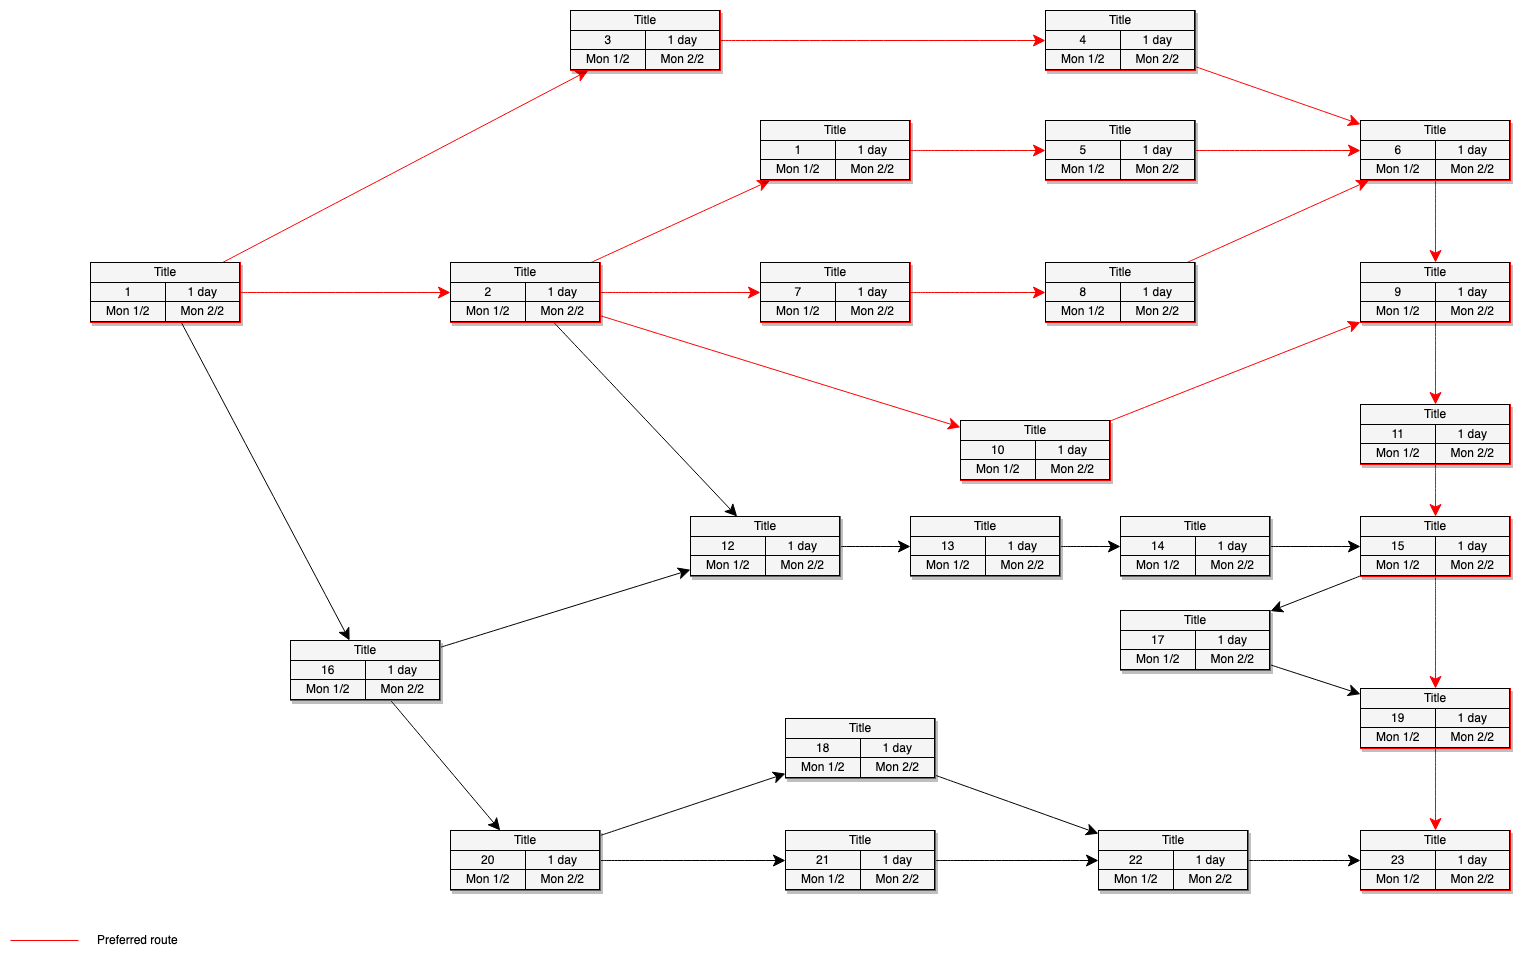
Open this PERT diagram in the diagrams.net viewer
Dependency graphs are often used in software engineering or IT, showing what each functional piece of code or infrastructure component depends on.
Call graphs (multigraphs) are a specific type of dependency graph that show the order in which procedures are called - either static (representing every possible path), or dynamic to represent one execution. Many development environements and compilers can generate call graphs which you can use to identify and safely remove dead code or pinpoint infinite recursion errors.
A Rendering Dependency Graph is a scheduling system that analyses and optimises each frame of video data to consume less memory and improve the performance of graphics APIs.
Puzzle dependency charts, narrative dependency diagrams and navigation graphs are used by game designers and writers to plan adventure and puzzle games and write books to ensure that their stories, puzzles and worlds are not overly linear and boring for their audience.
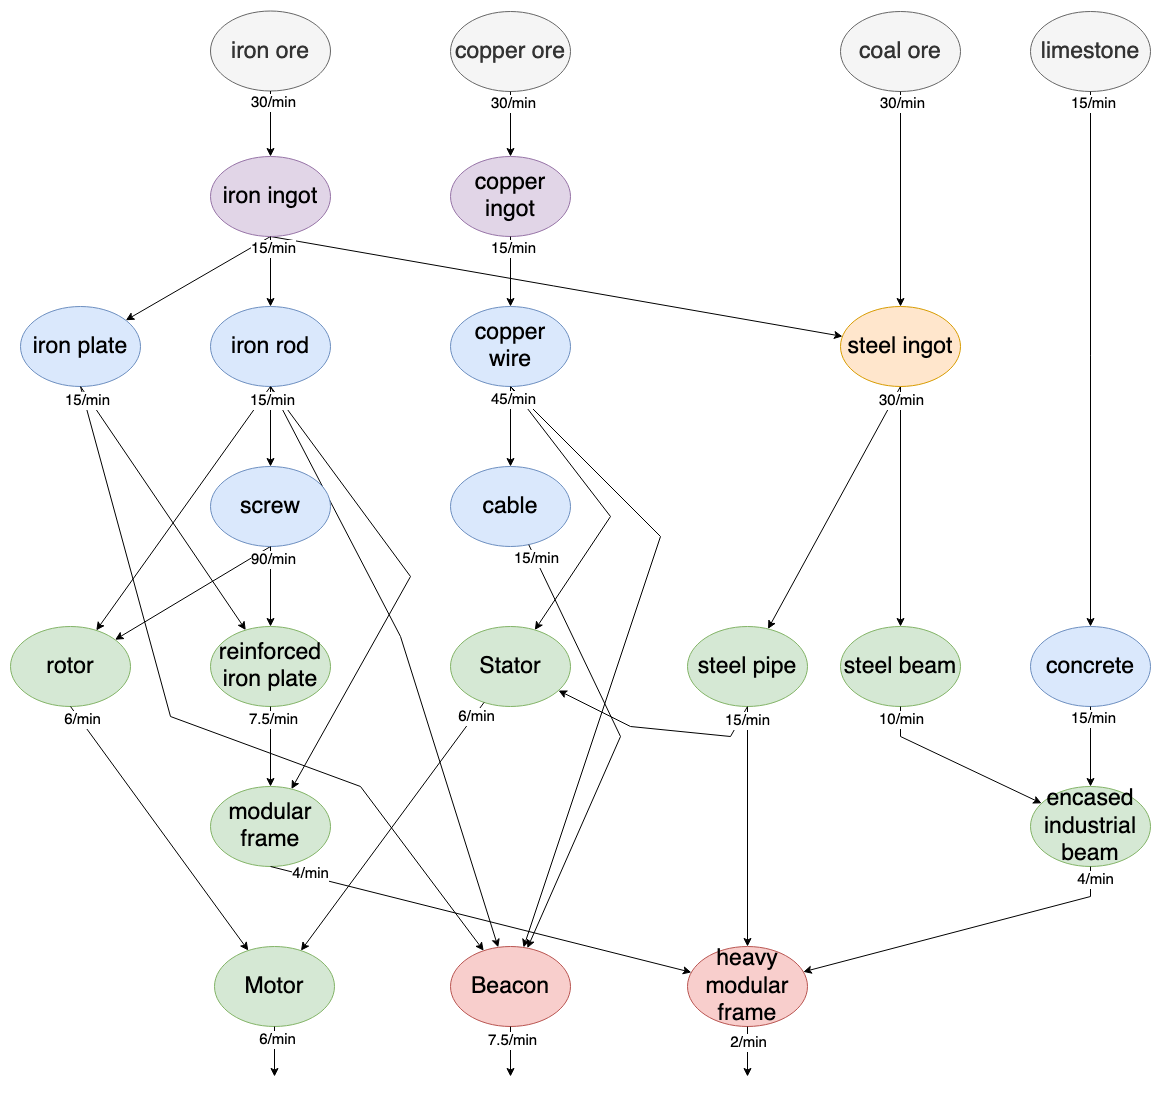
Games with Resource management and production chains use dependency graphs to constrain the research and build order, and to allow AI ‘players’ to choose strategies and assign resources. The following examples shows part of the production chain in the game called Satisfactory, with production speeds indicated on the connectors.
Tip: When building a dependency graph of a story or puzzle, start at the end and work backwards.
Create a dependency graph in diagrams.net
- Go to diagram.new, choose your storage location and create a new blank diagram, if prompted.
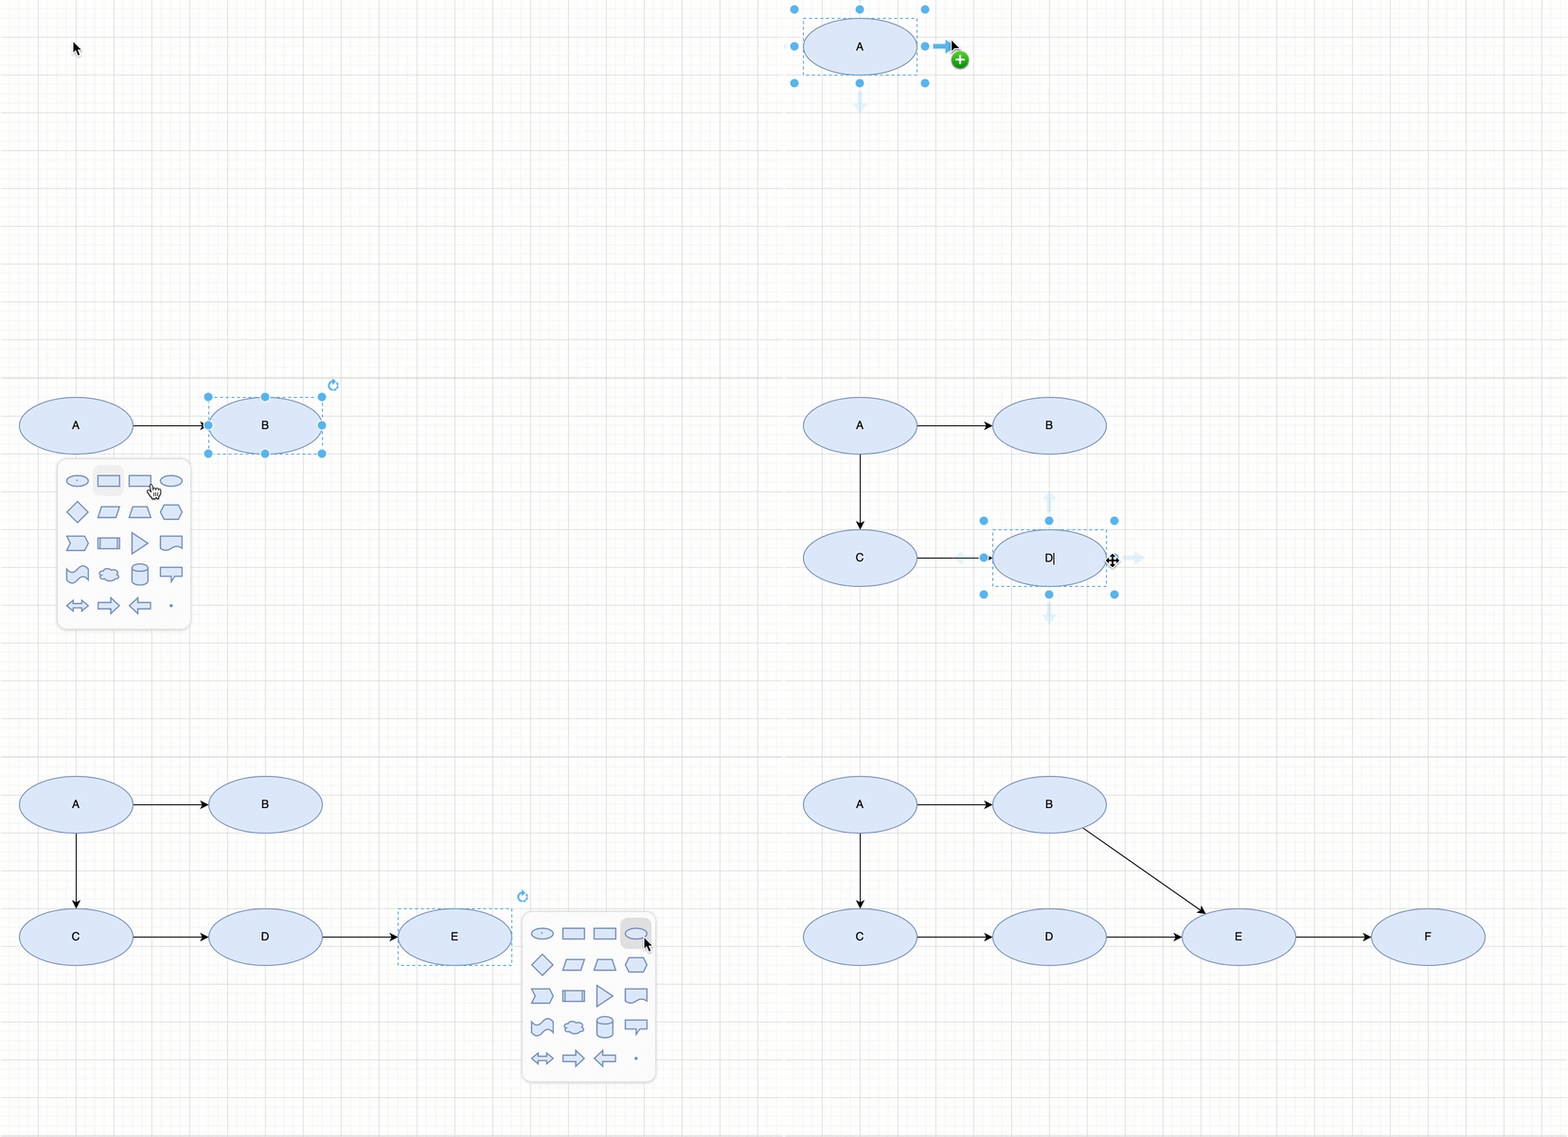
- Double click on the drawing canvas, and select the ellipse shape to add it to the canvas.
- Click on one of the four direction arrows on a node, and select a shape to add it to the canvas as a dependency from that node.
Tip: If you are creating a dependency graph for a softwareprogram, it can get complex quickly as you add more methods, or libraries, or components. It’s best to draw such diagrams early in development.
To document an existing complex system, it is easier to insert a text description of the system and generate the dependency graph automatically.
Dependency graph templates
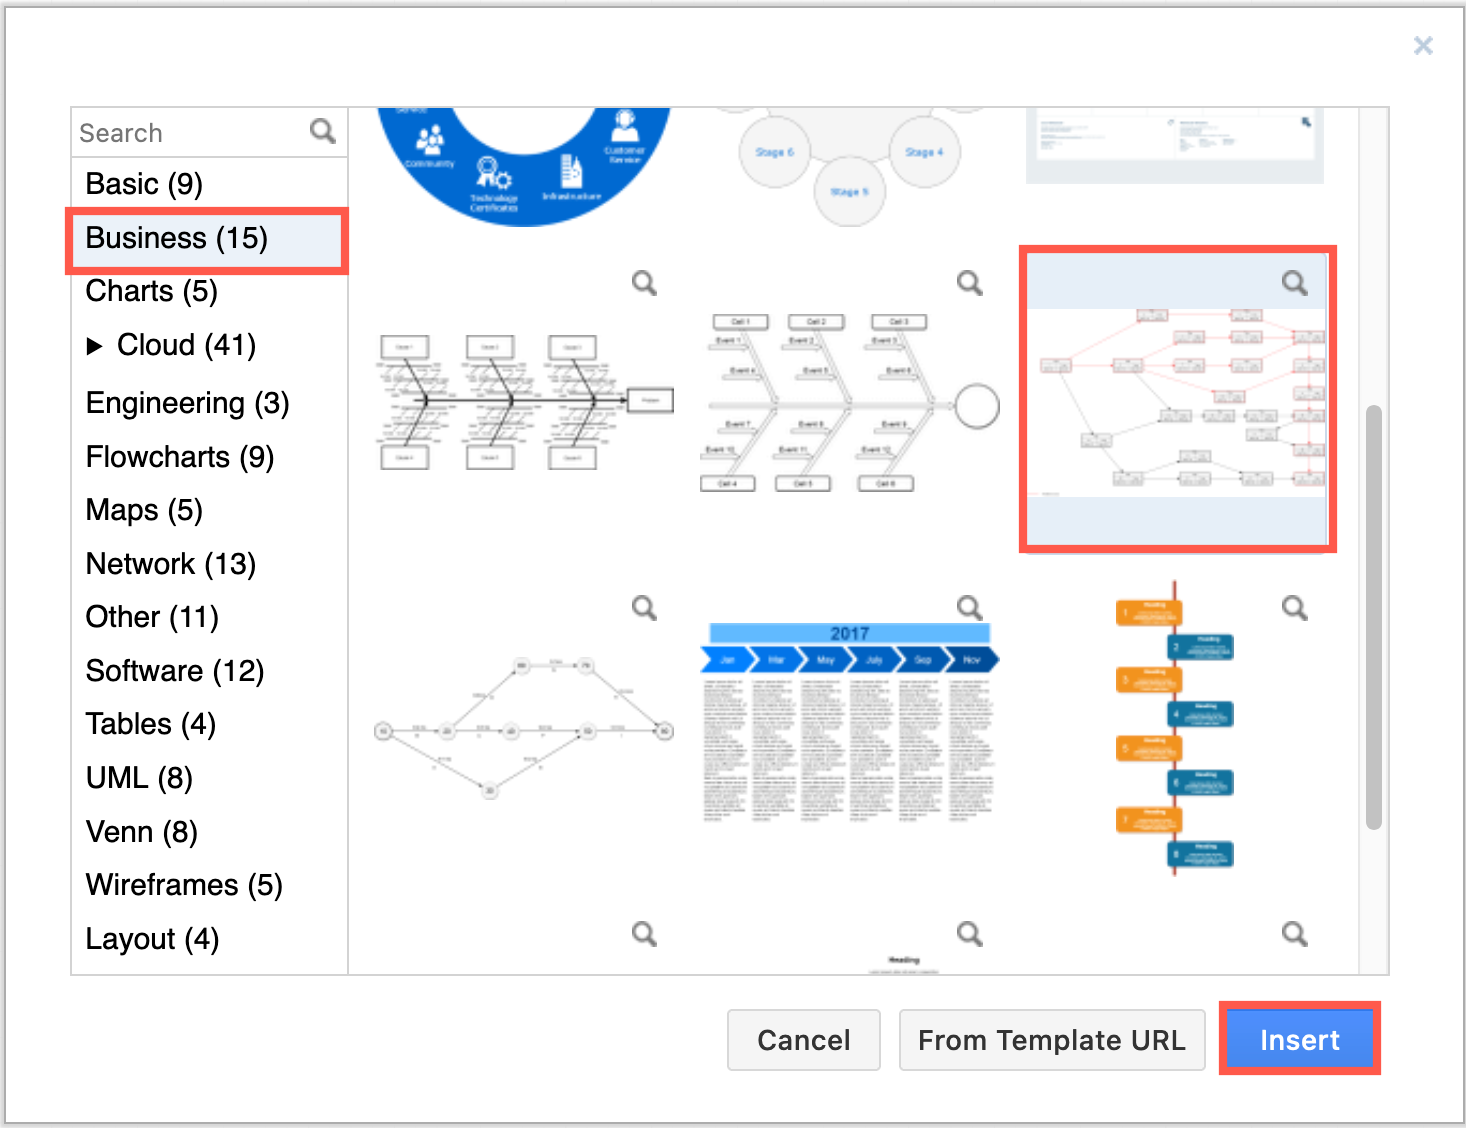
Dependency graph (PERT diagram) templates are available in the Business section of the diagrams.net template library.
- Create a new diagram at app.diagrams.net to see the template library. Alternatively, click Arrange > Insert > Template to open the template library dialog.
- Select the Business category on the left. Click on the magnifying glass in the top right of a template on the right to see a larger preview.
- Select a template, then click Create or Insert to add it to the drawing canvas.
diagrams.net website dependency graph
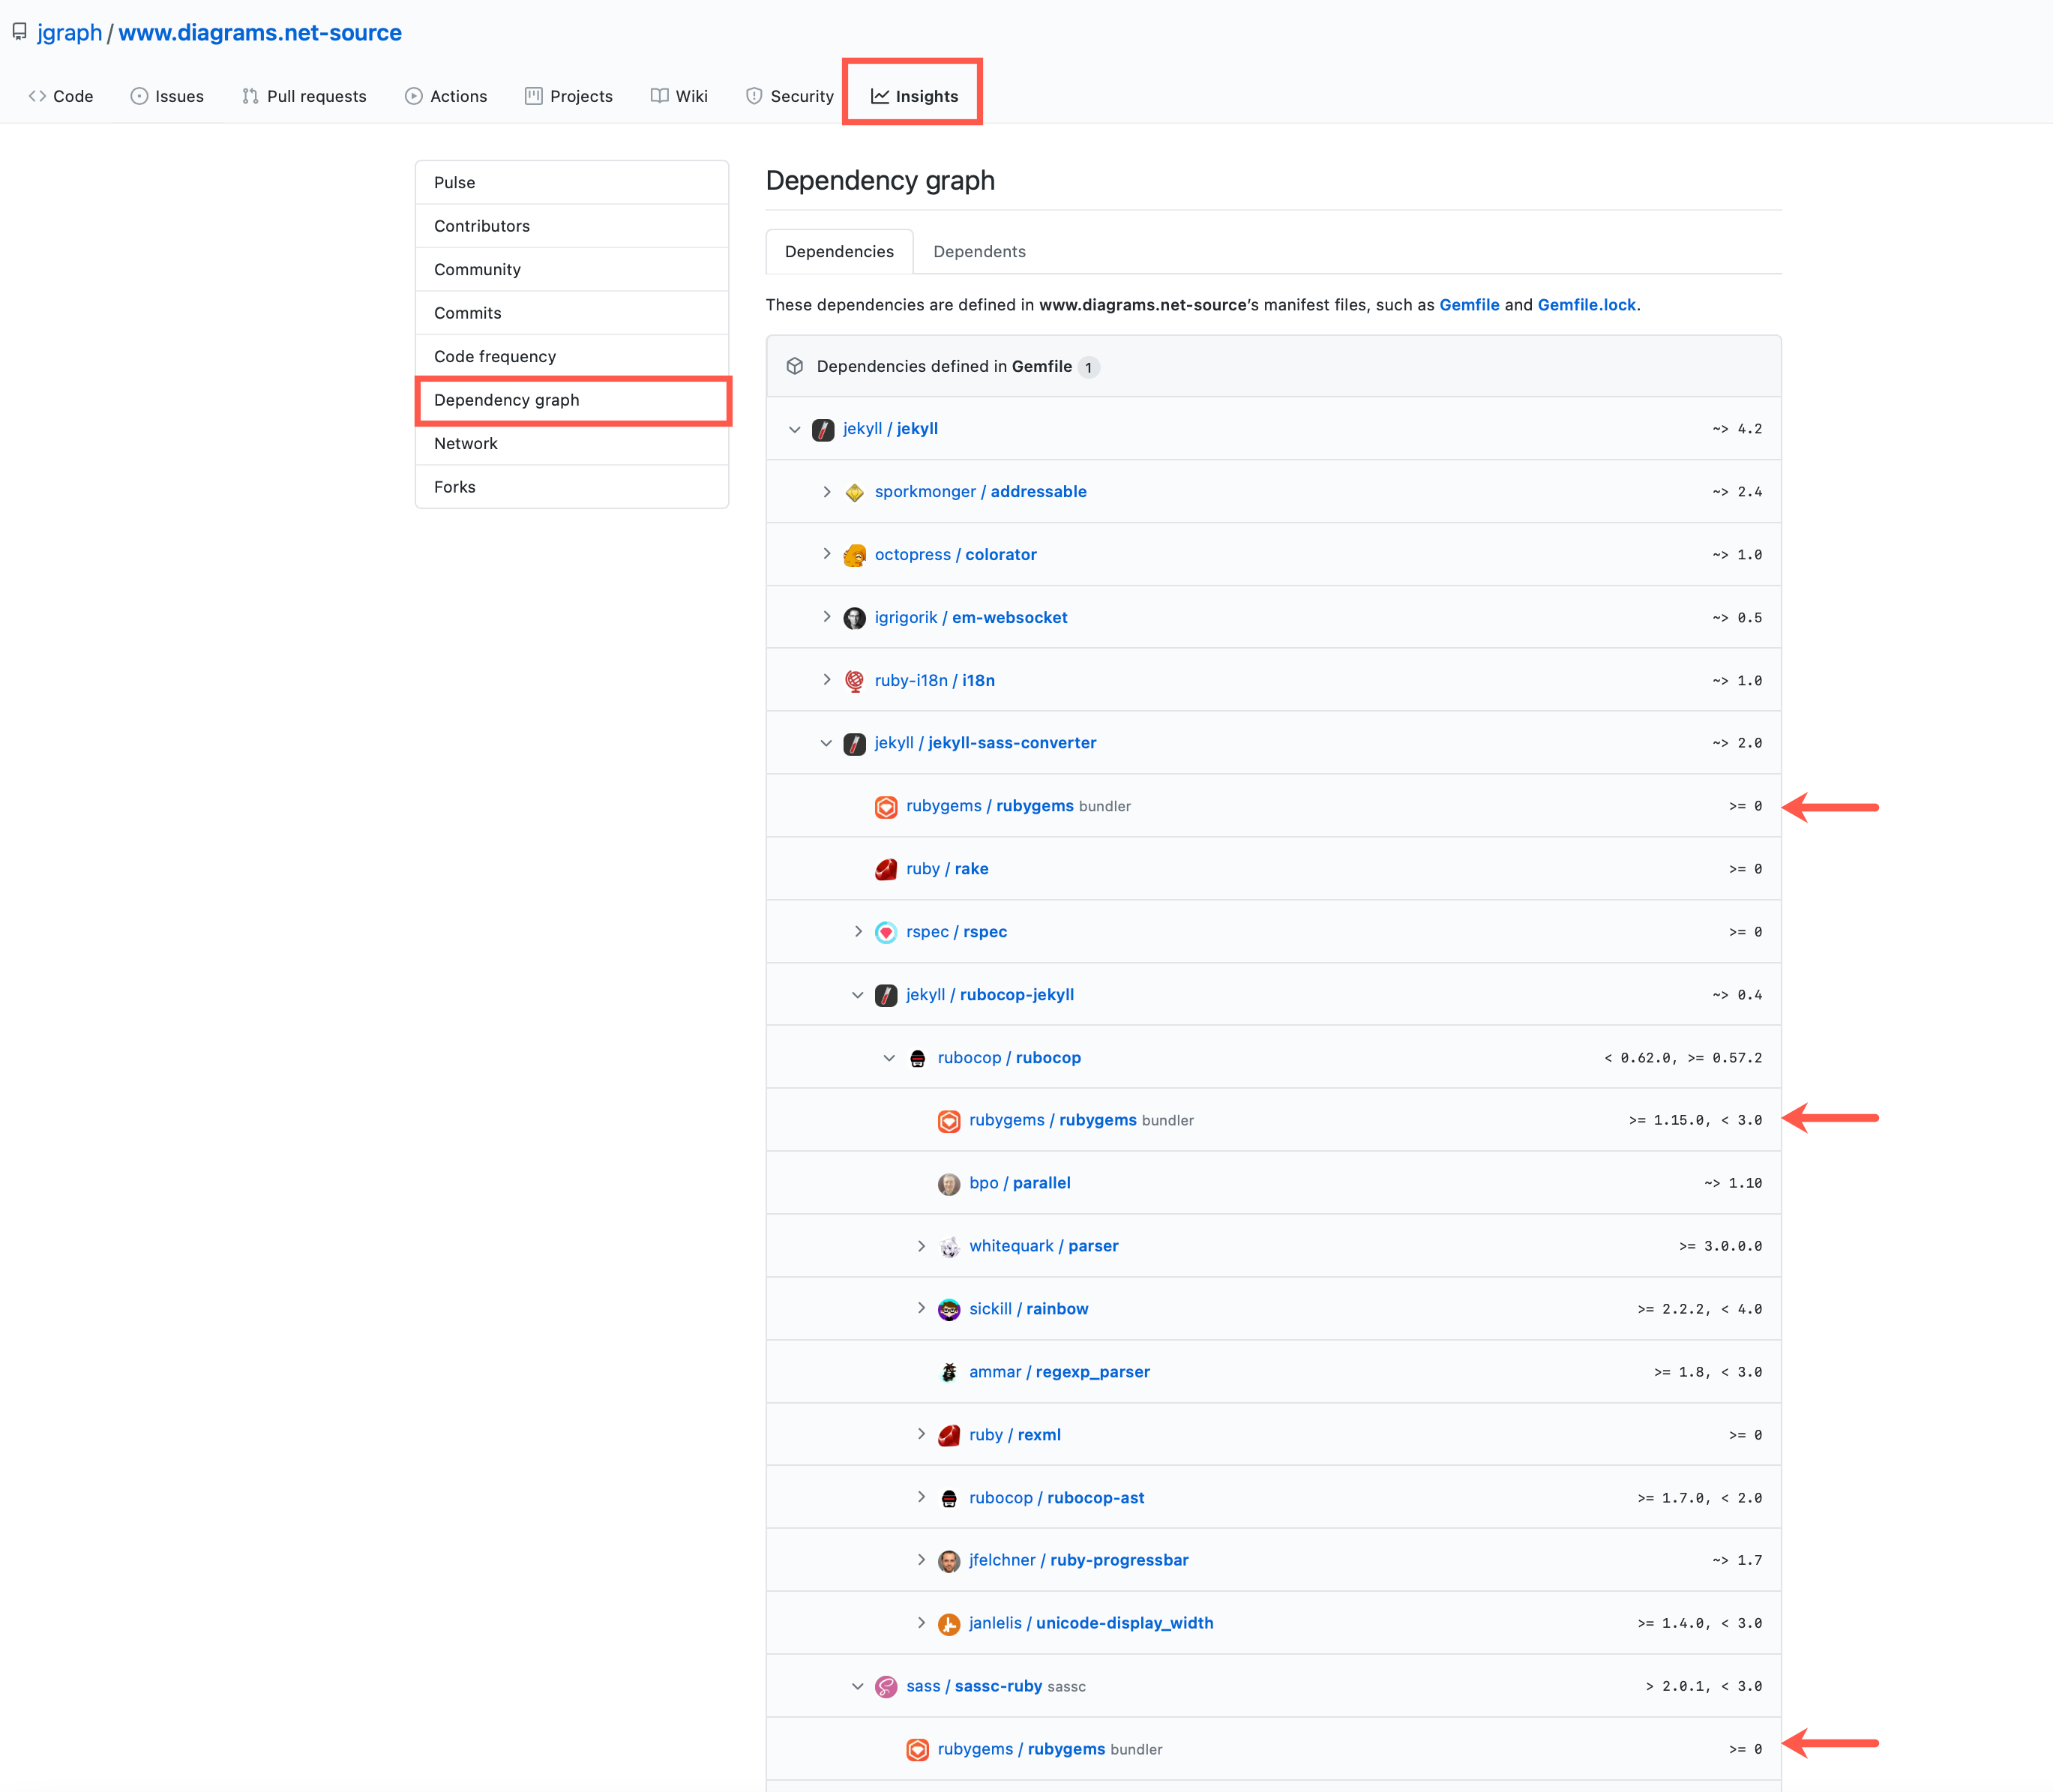
In the www.diagrams.net-source repository on GitHub, you can see the dependencies of the website build system as indicated in the Gemfile and Gemfile.lock manifest files (in GitHub, click Insights > Dependency graph).
Click on the > arrows to expand a section of the GitHub dependency graph. Where components have multiple dependencies, they will be listed several times under different components.
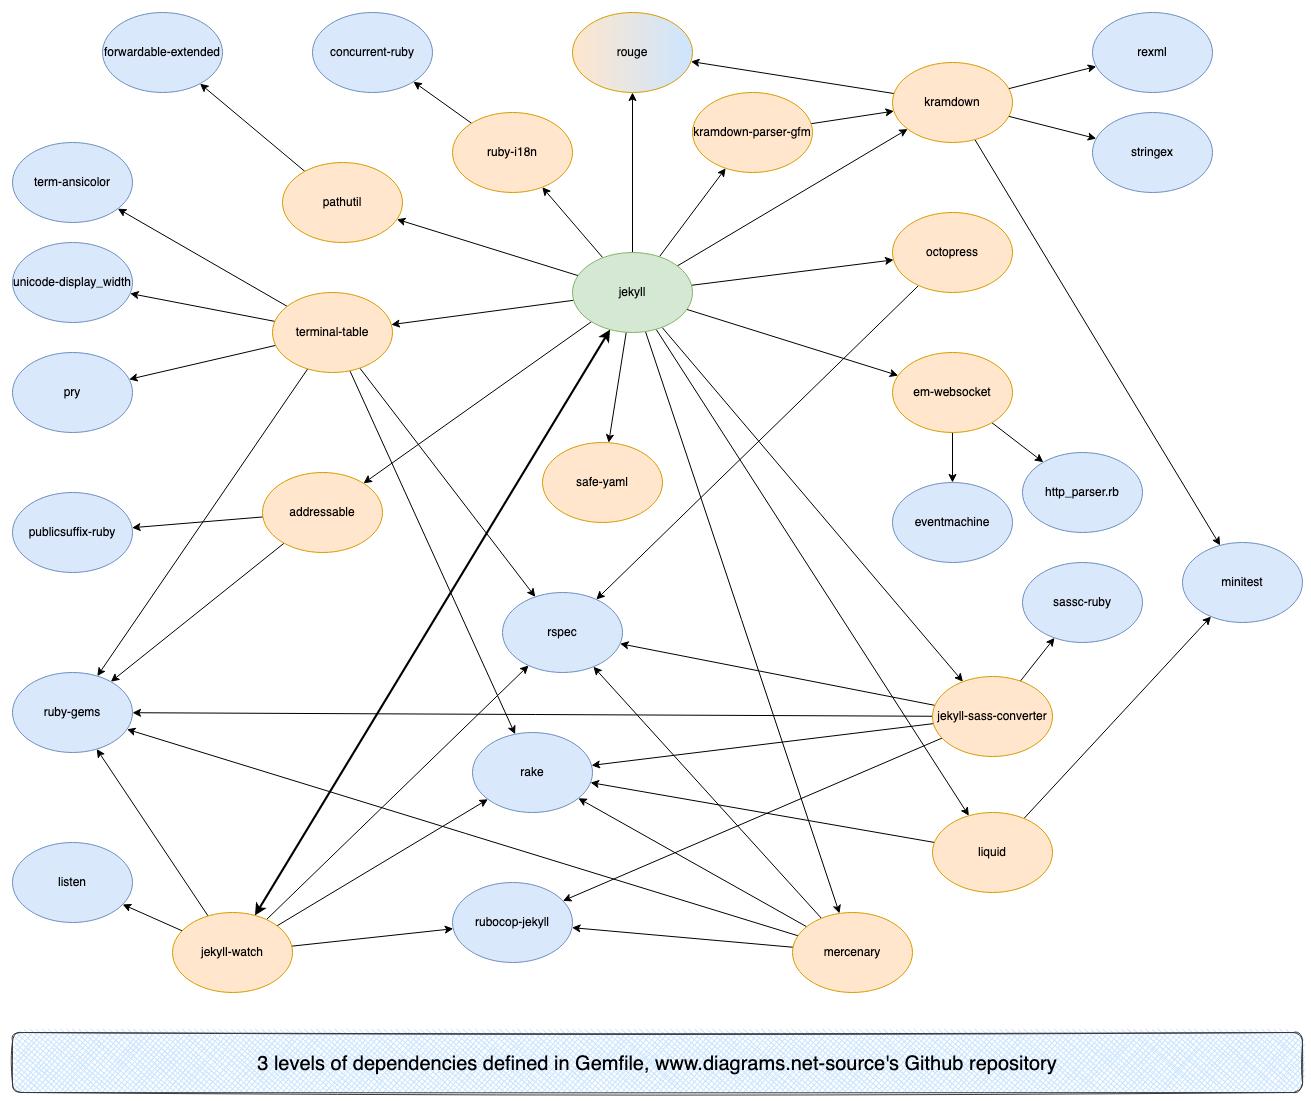
It is easier to understand how these dependencies relate to each other visually, even though the diagrams can get very busy as you include more and more levels of dependencies.
The following example dependency graph shows only three levels of dependencies in the Gemfile used to build this diagrams.net website.
Open this example in the diagrams.net viewer
Did you know?
GitHub open source software projects may show the dependency graph in the repository. GitHub’s dependency reviews via Depdendabot use these dependency graphs to analyse new dependencies and help you identify potential security vulnerabilities, incompatible licenses, and maintenance risks in pull requests.
Autogenerated dependency graphs
There are many tools which can analyse your code and generate a text description of the procedure calls in the Graphviz DOT graph description language. In diagrams.net, you can insert this text description to automatically generate a dependency graph.
In the example below, the first three levels of dependencies in the Gemfile were used to auto-generate a diagram. The text description of the dependency graph lists all of the outgoing links from each node, one per line, as follows:
www.diagrams.net-source->jekyll
jekyll->addressable
jekyll->colorator
jekyll->em-websocket
...
- Click Arrange > Insert > Advanced > From Text. Alternatively, click the
+icon in the toolbar, then select Advanced > From Text.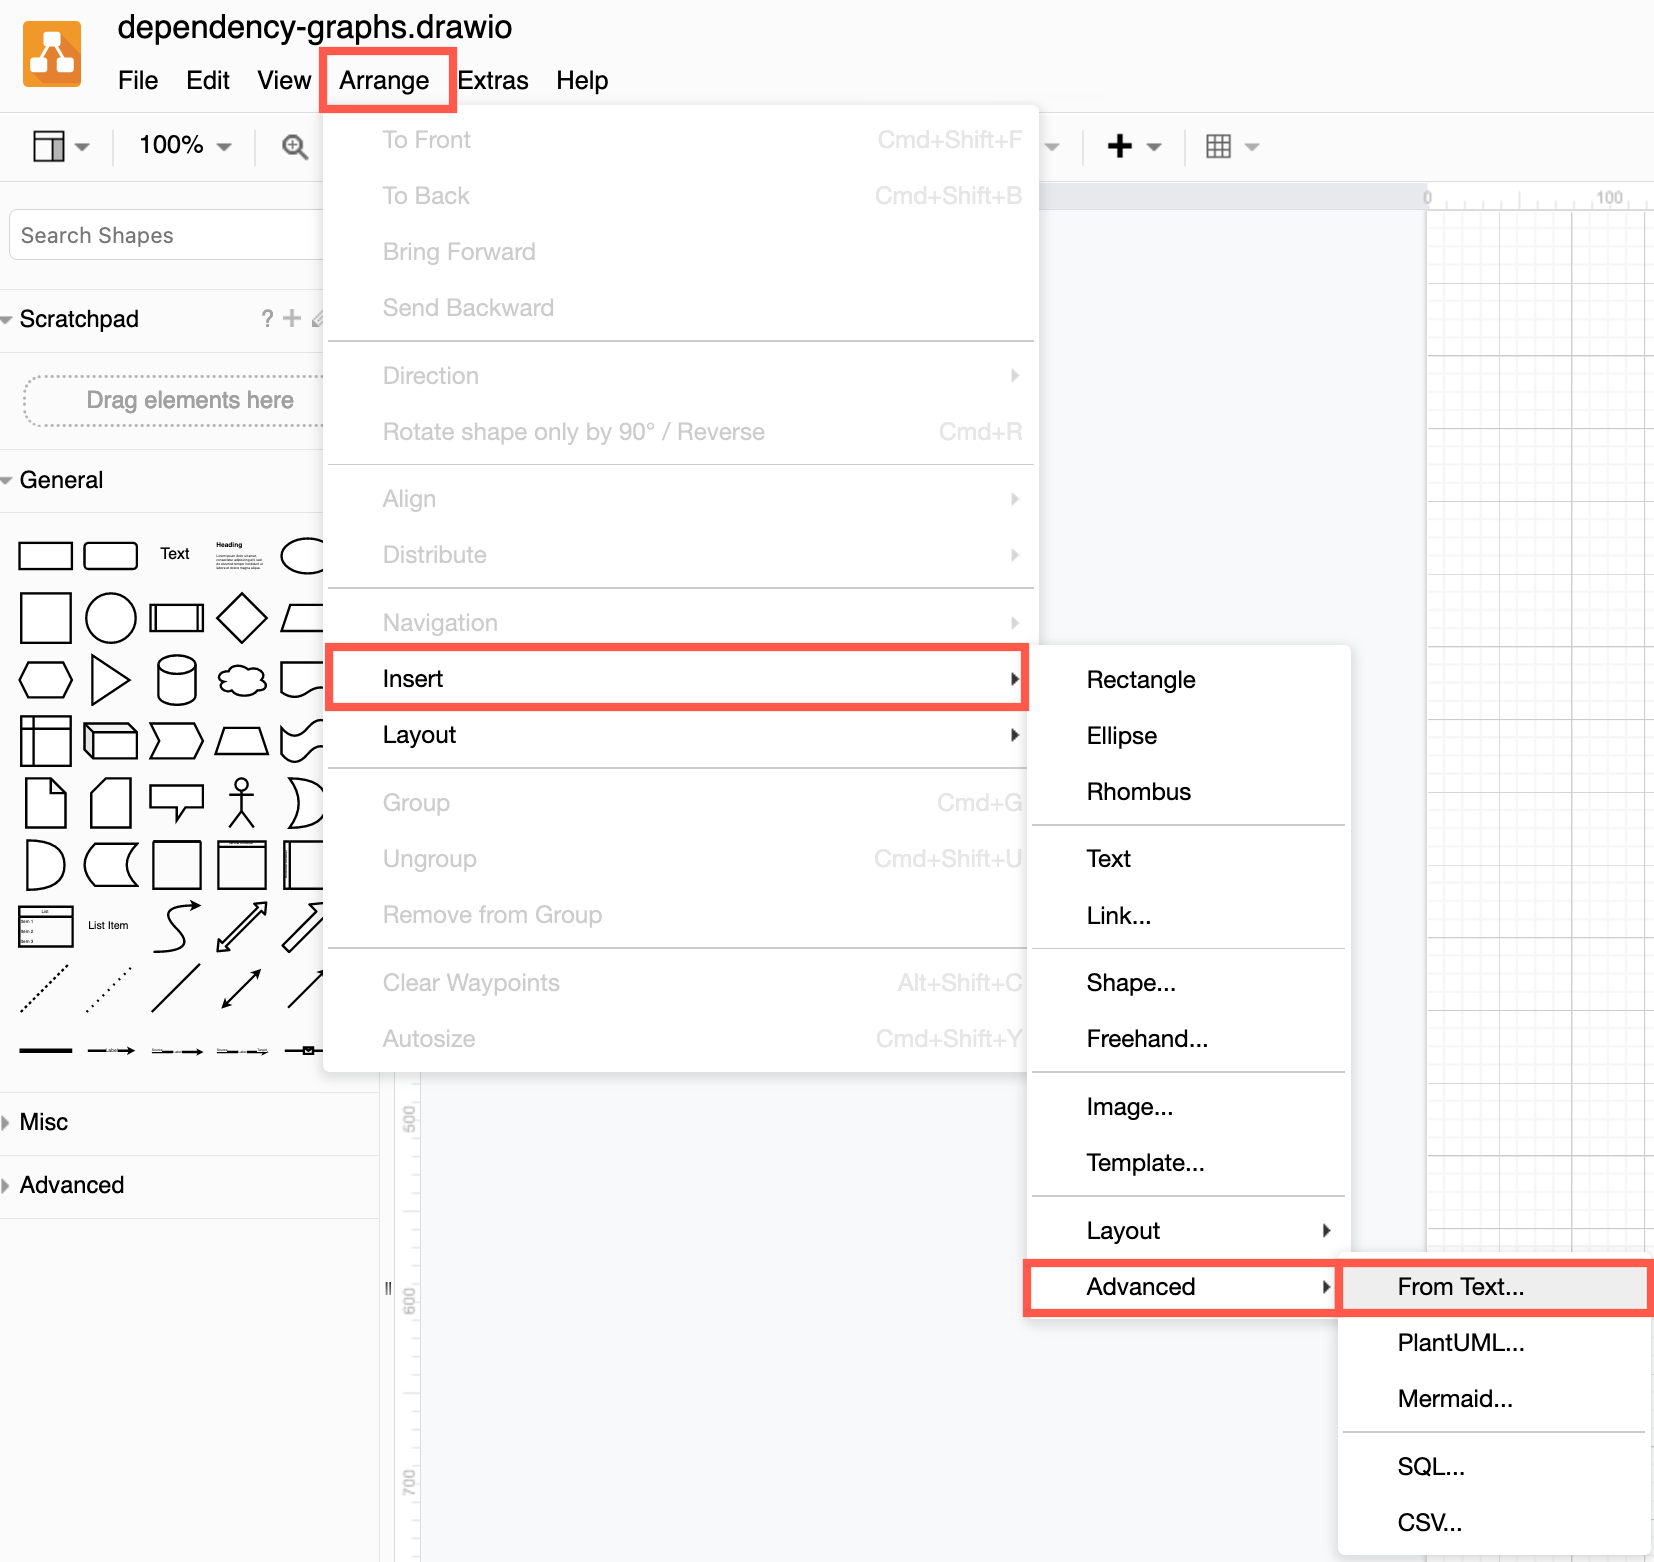
- Select Diagram from the list below the large text box.
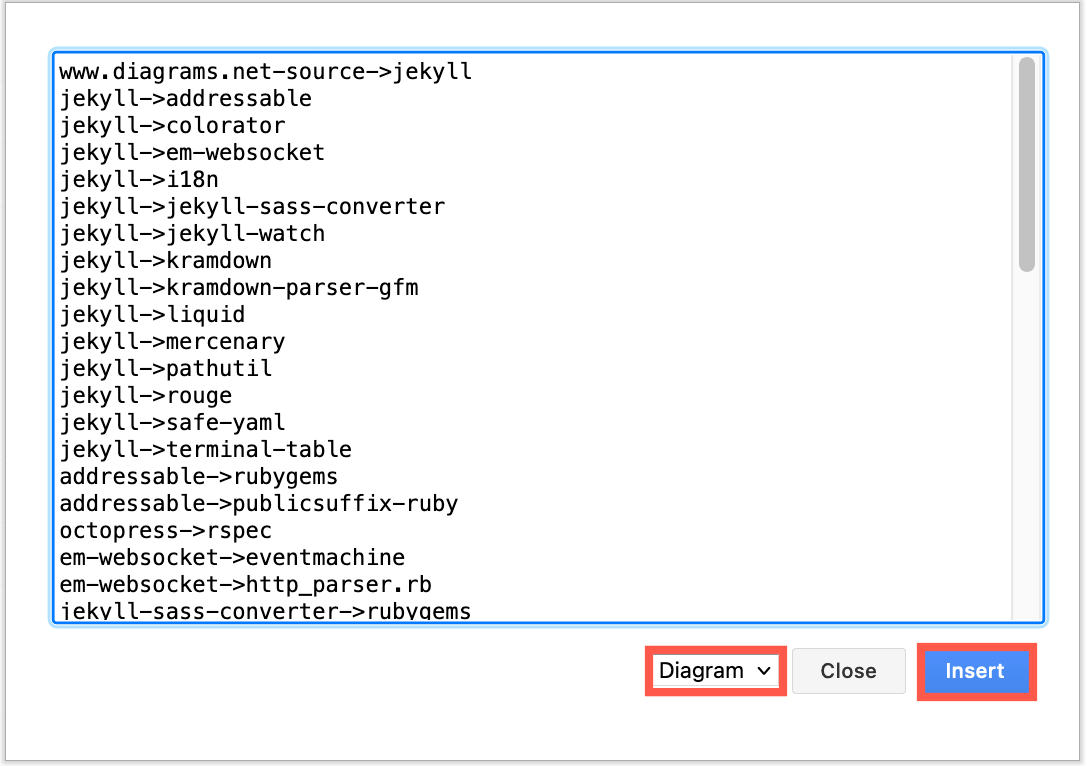
- Paste your text into the large text box, then click Insert to generate your diagram. You can now style and rearrange the nodes and connectors.
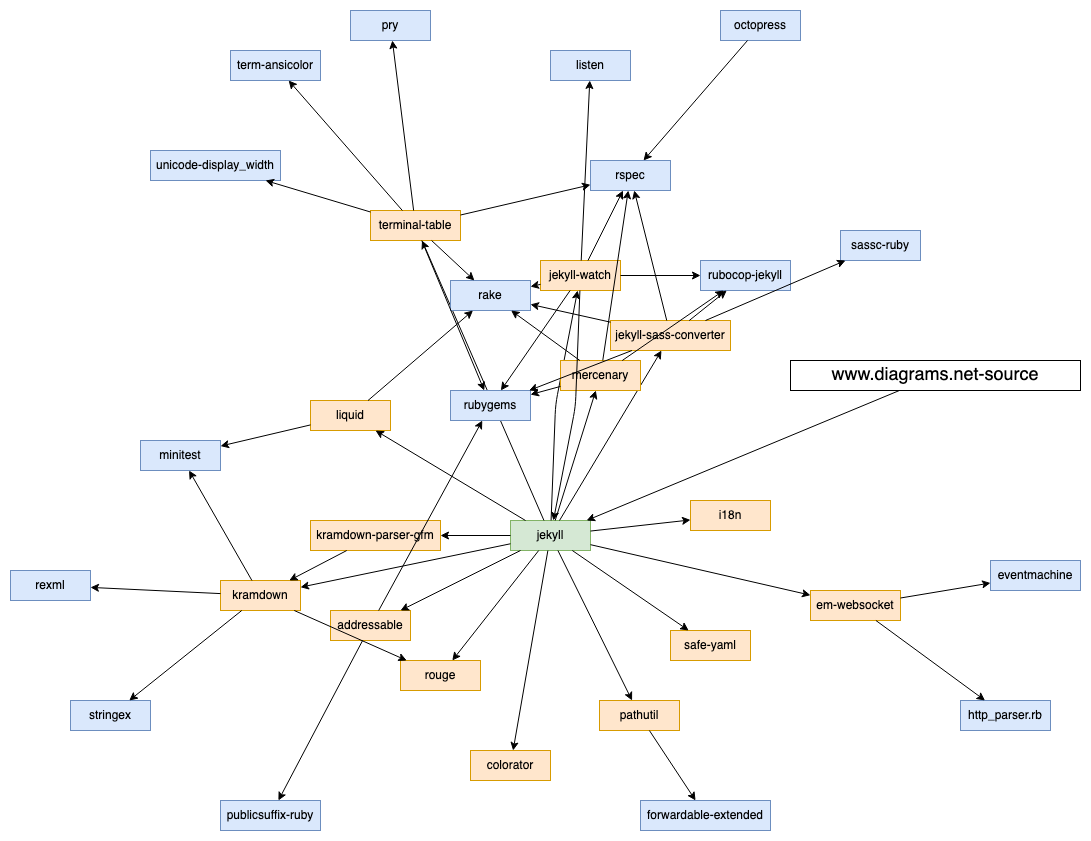
Open this dependency graph in the diagrams.net viewer
Mermaid dependency graphs: You can insert a dependency graph using Mermaid syntax in a similar way. Click Arrange > Insert > Advanced > Mermaid to open the Mermaid input dialog.
Dependency graphs from spreadsheets: You can insert CSV text along with formatting information to auto-generate and style a dependency graph from CSV data. Click Arrange > Insert > Advanced > CSV to see an example of CSV data and formatting information.